
Tags
credit cards, credit risk, niche, platform company, PLCC, private label, SYF, Synchrony, two-sided markets
Two years ago, I investigated the moat around American Express’s (AXP) business. I assessed the moat as wide and identified a positive feedback loop at the heart of it. The loop ran like this:
- Spending on Amex cards is higher on a per-card basis than its competitors
- Merchants want to accept the Amex card to attract these high-paying customers
- This affluent customer pool enables Amex to charge higher discount rates
- Because of the revenues generated from higher-spending Cardmembers, Amex has the cash to invest in more attractive rewards and other benefits to Cardmembers
- The rewards program in turn creates incentives for Cardmembers to spend more on their Cards.

This feedback loop was supported by a mutually reinforcing set of features of the business model: the closed-loop system, the prestige brand image, a spend-centric focus rather than lend-centric, etc. The whole model held together beautifully – until it didn’t.
On February 12, 2015, AXP announced that its 16 year relationship with Costco had ended. Shares of AXP have dropped 24% since that time.
The event triggered the following exchange between a shareholder and Charlie Munger and Gerald Salzman of the Daily Journal Corporation:
Q: I’d like to get your thoughts on American Express [AMEX]. Do you think its moat has narrowed recently?
Mr. Munger: I don’t think it was desirable that it lost its contract with Costco [COST]. Again, that’s an example of what tough capitalism is. Obviously, other people are willing to do it cheaper. It just shows how tough a position that looks impregnable can be in modern capitalism. It’s what makes everything difficult.
To those who already have some money, I think that’s just the way it is, and American Express has had a long period of very extreme achievement and prosperity. I think they’ll have a lot of prosperity in the future, but it doesn’t look quite as easy as it once did. Now, the head guy would say it’s always been hard, he’s been battling hard, but we paddled hard here too, and what good did it do us in Daily Journal’s print business? We paddled like crazy, didn’t we Gerry?
Mr. Salzman: We tried. It was hard.
Mr. Munger: Yeah, what happened is you just keep receding and receding. Welcome to adult life. (emphasis added)[1]
Amex had one of the most durable business models ever designed. Could the good times be over?
What Happened to AXP’s Moat? The Changing Credit Card Landscape
AXP operates a two-sided platform company. On one side of the platform are merchants. On the other side of the platform are consumers.
A key strategic dilemma for all platform companies is how to create equilibrium on both sides of the platform. That is, what combination of charging one side and subsidizing the other will maximize profits? Here are examples of how other platform companies have handled this problem:
| Company | Subsidy Side | Monetization Side |
| Ticketmaster | Venues | Ticket Buyers |
| Searchers | Advertisers | |
| Newspapers | Readers | Advertisers |
| eBay | Neither | Sellers/Buyers |
| AirBNB | Neither | Hosts/Visitors |
AXP discovered that by heavily subsidizing the consumer-side via rewards to bring in big spenders, it could heavily charge the merchant side and minimally charge the consumer side. The heavy charges on merchants funded AXP’s spending on rewards for cardholders. The Starwood Preferred Guest (SPG) card is a good example. No other card allows you to accumulate SPG points at a rate of one per dollar spent. Even in Amex’s on point network, these SPG points go for ~3 Amex points to 1 SPG point, so it’s a great deal at 1 per dollar of spend. These generous rewards lured in the customers.

Recently, this fragile equilibrium has been destabilized by three forces.
Force #1 – The Rebellion of the Merchants
For years, the arrangement was a win-win for everybody as merchants put up with the interchange fees since AXP cardholders spent much more than anybody else. But recently, volume and margin pressure on traditional retailers from internet players forced them to take a hard look at this expense. As Munger alluded to, retailers, like Costco, are increasingly questioning the high fees of general purpose cards (around 2.5% for Amex merchants) and the return they get on that investment.
Accordingly, Amex’s discount rate (the service fee they charge retailers) has been dropping for years.
American Express Average Discount Rate, 2003-2015

Source: AXP data via Sentieo.com
Force #2 – Increased Rewards Competition
The high returns generated by AXP attracted competition, resulting in rising rewards spending (more points / cash back) and therefore margin pressure. The success of these new rewards schemes put Citi, Bank of America, Capital One and other issuers on the same level the previously untouchable Amex. Once unthinkable, AXP is now viewed as just another vendor providing a commodity service. Reportedly, the CEO of Costco told AXP that he viewed them in the same light as the company that sold ketchup to Costco. He added: “If I can get cheaper ketchup somewhere else, I will.”[2]
Force #3 – Increasing Uncertainty and Technological Disruption
A number of payments innovations have emerged in the past five years, leveraging mobile and connectivity to make payments simpler and add value. These innovations include: mobile payments, integrated billing, streamlined payments and next generation security. These changes are creating uncertainty in the industry. Will they drive a fundamental paradigm shift?
Is There Still Money To Be Made In Issuing Credit Cards?
As investors, given the turmoil in the payments industry, do we put the sector in the “too hard pile” and move on? Or, is Mr. Market over-stating the risk and a closer look at the industry can reveal some gems?
Private Label Credit Cards
Consumer credit cards generally break down into two types: general purpose cards and private label cards. General purpose cards can be used to purchase goods and services at a wide range of merchants. General purpose credit card issues include AXP, Capital One, Discover, Citi, Bank of America, et. al.
In contrast, private label credit cards (“PLCCs”)—sometimes called “store cards” or “retail cards”—can be used only at a particular merchant or affiliated group of merchants. PLCCs carry branding from the relevant merchant. Like general purpose credit card accounts, PLCCs are originated and serviced by credit card issuers. A credit card issuer will contract with a specific merchant to offer PLCCs to that merchant’s customers. Consumers often apply for—and are issued—PLCCs in a merchant’s store or via its website. These cards typically provide consumers with lower credit lines than general purpose cards, and credit underwriting is generally less stringent on private label cards.
Among the major issuers of PLCCs are Citi Retail Services, Synchrony Financial, Capital One Financial Corp., Alliance Data Systems, TD Bank, Wells Fargo & Co. and JPMorgan Chase. As of 2014, Synchrony Financial (SYF) was the market leader with a 41% share and only provided PLCCs (no general purpose cards).
PLCCs represent a niche within the credit card industry that I believe will continue to flourish.
Synchrony Financial (SYF)
The key to understanding SYF and the PLCC industry is the business model. As we have seen, AXP created a wide moat by charging the merchant side and rewarding the consumer side. This worked for years until merchants rebelled against the high discount rates, the competition for high-spending, low-risk cardholders intensified and the brand lost its luster.
SYF flipd the AXP approach. Unlike AXP, SYF does not charge the merchants at all. In fact, it gives them a share of its revenue. SYF charges the consumer side of the market in the form of interest payments. (This is similar to the strategy Ticketmaster used to out-flank Ticketron.) It is best to see SYF as a technology-enabled business service provider like ADP, Paychex, Fiserv, MasterCard, Equifax and the aforementioned Ticketmaster. In substance, the merchants out-source their customer financing operations to SYF.
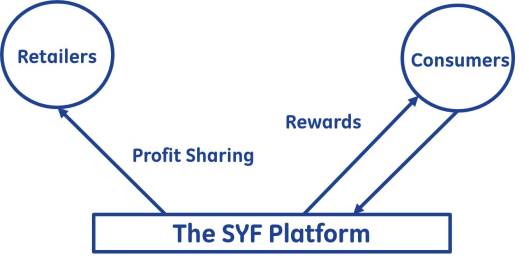
Synchrony’s Value Proposition for Merchants
SYF provides a clear value proposition for merchants:
- No intercharge fees. Private label credit card is the least expensive method of payment stores can accept. For that reason alone, it makes fundamental sense for every retailer to carry a program if feasible
- Revenue Share Agreements. SYF also gives direct monetary subsidies to merchants. 4.5% of receivables
- SKU-level data. Like AXP, SYF operates a closed-loop system. In a traditional open loop network such as Visa or MasterCard, limited data can be collected by the card issuer. The issuer does not own the data. In a closed loop system, the transaction runs on the issuer’s own network. This allows the issuer to capture SKU level detail on the transaction.
Why is this data important? This allows brick-and-mortar retailers to more effectively compete with Amazon. “I think the reality is many of our retailers are up against Amazon. And Amazon has a great closed network. They know what you are buying. They know how long you’re on a page. They can see what you’re looking at. They could say you should by this with it or did you think of that. That’s what the retailers are up against.”
With the SYF data in-hand, the merchant-partner now has access to the customers’ identities, locations, behaviors, preferences and level of activity. A direct relationship with the customer can enable more specific market intelligence, fostering faster, iterative product development cycles that work to further align interests between companies and their customers.
- Incremental Sales. Retailers have repeatedly found that PLCCs make a difference in building loyalty and increasing sales. For those retailers with high sales penetration, the branded credit card program is an integral part of their strategy and DNA. As shown in Figure 1, Kohl’s discloses that its private label credit card program accounts for nearly 60% of total retail sales bolstered in part of a steady stream of credit events.

Retail Card Sales Penetration of Total Sales
(includes private label, co-brand and debit) Source: First Annapolis
On average, retailers that have credit card programs see their cardholders spend more and shop more frequently than the average customer. Target has stated that its REDcard customers tend to visit twice as often and spend approximately 50% more than the average customer. Other retailers have shared favorable views on their card programs:
- Bon-Ton – “We continue to see outstanding growth in our proprietary credit card and loyalty program. Proprietary credit card sales were up 3.1%, while penetration increased 223 basis points to 53.2 of total sales.” (Q3 2015)
- HSN – “ Our private-label credit card has been very successful. It’s now six years in. Over one-third of our sales are now transacted on that private-label credit card. And it continues to be a great partnership and a great loyalty driver.” (!2/7/15 UBS Global Media and Communications Conference)
- hhgregg – “There is a long-term lifetime value to getting an hhgregg credit card in that customer’s hand, that consumer is three times more likely to purchase at hhgregg over the next 12 months, than a consumer that doesn’t have our credit card.”(Q2 2016)
- Nordstrom – “(W)e’ve always tried to build a long-term relationship with our customer through our credit card, and the customers that have joined us and that have opened accounts have been very loyal.” (Q3 2015)
- Stein Mart – “Our credit card is a proven sales driver as our cardholders are our most frequent visitors.” (1/13/16 ICR Conference)
- JC Penney- “ (O)ur credit customer spends about 2.5 times more than our non-credit customer, they attrite half as much, they like us twice as much as the non-credit customer. And obviously we get revenue from it and we do not have to pay Visa or MasterCard for that transaction. It is really a win/win/win for us, so we continue to be focused on driving our penetration.”(Q4 2015)
(Note: JC Penney and Stein Mart are merchant-partners of SYF.)
- Outsource Credit Risk. PLCC arrangement allow retailed to outsource card operations so companies can concentrate on core competencies. Retailers attempting to underwrite debt can run into serious conflicts of interest among other problems.
For these reasons, merchants are highly incentivized to make SYF’s cards a success. For these merchants, SYF is not a mere payment processing vendor as COST saw AXP.
Value Proposition for Consumers
SYF also has a compelling value proposition for customers although it is far more straightforward. It can be summed up in a single word: rewards. Customers typically receive merchandise discounts once a pre-determined spending goal is hit on their PLCC. These loyalty programs are designed to generate incremental purchase volume per customer, while reinforcing the value of the card to the customer and strengthening customer loyalty.
As a result of these compelling value propositions, SYF is experiencing steady growth. As you can see from chart below, annual average receivables is decreasing for the top 3 issuers while increasing rapidly for the PLCC providers, SYF and ADS. In total, US credit card receivables grew at a 3% CAGR.[3]
Credit Card Accounts Receivable, US Operations Only, 2011-2015
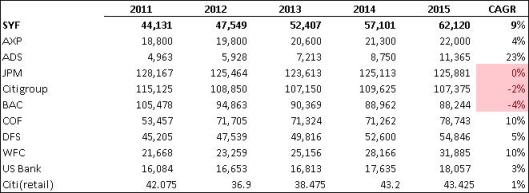
Source: Company filings via Sentieo.com
What Else Do I Like About SYF?
Pricing Power
The average yield on SYF’s credit-card loans was 21.7% in the fourth quarter, versus 14.3% for Capital One Financial(COF), which has a limited presence in PLCCs. These higher APRs partly presumably reflect a higher credit risk. Have they priced the debt correctly to compensate for this risk? It would appear they do a better job of it than the general purpose competitors. If you look at this risk-adjusted yields in the chart below, SYF outperformed the general purpose card peers by a wide margin through the crisis, with our risk-adjusted yield running over 700 basis points higher than the peer group. As we have moved beyond the cycle and losses have declined, the risk-adjusted yield outperformance compared to the general purpose card issuers widened to over 800 basis points in 2014.
Cost Advantages
SYF has the lowest efficiency ratio of the main credit card issuers.
Efficiency Ratio of Major Credit Card Issuers, 2011-2015
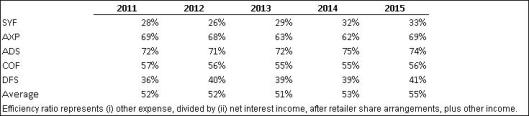
Source: Company filings via Sentieo.com
The main driver behind the higher margins and returns is the limited physical infrastructure (internet bank funding and internet card issuing) combined with economies of scale.
The efficiency ratio has expanded in recent years on the back of GE separation expenses, the roll-out of EMV chips in credit cards and some marketing cost inflation. I expect that the efficiency ratio will continue to trend upwards albeit at a slower pace after the split-off. The gap with peers should remain substantial.
SYF’s customer savings deposits are low cost form of borrowing. Credit card issuers fund their assets (credit card receivables) via either retail deposits or wholesale money (overnight funds on the money market, funds from the U.S. Federal Reserve discount window, securitization, warehouse lines of credit etc.). Each type of funding source has a different cost of funds Historically credit card issuers (like Capital One and MBNA) financed those loans by borrowing in the asset backed securities markets. Now that the ABS market is less liquid than it used to be, most credit card issuers have merged with banks and use the consumer deposits of the bank to finance the credit card loans. Bank deposits now provide 64% of SYF’s funding. In Q4 2015, SYF’s overall cost of funds was 1.8%.
Investment Case
As of March 8, 2016, SYF is $27.70 per share and has a P/E of 10. Given the depressed value of SYF, it does not seem too difficult to hit my 10 year hurdle rate of 15% yield. This requires a 6% CAGR for income before tax. It is based on the following assumptions:
- Loan Receivables Growth: 7%
- Net Interest Margin: 15%
- Net Charge Off Rate: 6.4%
- Efficiency Ratio: 34%
These assumptions are broadly in line with the historical averages. However, the historical averages are not particularly meaningful given the company’s short history as a public company (discussed more below).
Further, my assumed 6% CAGR for IBT is substantially higher than the 2011-2015 CAGR of 4%. Is this achievable?
Key Variables
- Competition –
Over the past few years, purchase volume of SYF customers has grown much faster than the market as a whole.
SYF Purchase Volume v. US Retail Sales Growth, 2012-2015
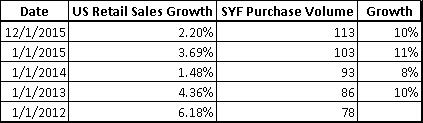
Source: Federal Reserve, Company filings via Sentieo.com
Some of this growth is due to the general shift from cash and checks to electronic payment. But, some of it is also due to the attractiveness of its business model as its growth has been more rapid than most of its general purpose peers. How long can this continue before the growth rate reverts to the retail sales rate?
Given SYF’s unique business model, it makes sense to approach competitive threats on two levels: competition for new merchant-partners and competition for existing merchant-partners. Management has indicated that organic growth in receivables over the past 4 years was 7-9% while the overall CAGR for receivables was 9.32% over this time period.[4]
- Competition for New Partners
As we saw with the Costco/Amex story above, competition for merchant partners is intense. The Costco deal with Citi left some observers shaking their heads. How could Citi be making a profit on it? Other issuers are willing to accept similar returns. SYF will not compete on price alone which winning new business more difficult. Management has indicated as much by saying most future growth will be organic.[5]
I think there is a greater than 75% chance that inorganic growth slows due to greater competition.
- Competition for Existing Partners
SYF’s relationships with merchants tend to be sticky. Switching private label card issuers is complex and costly. Most significantly, SYF has dedicated teams working within the retailer’s marketing and data analysis department. As Margaret Keane, President & CEO of SYF, explained how this works: “For the in-store experience, our field sales team, we have about 600 people out there who work with our partners, they have Salesforce.com, they can walk into a store or a club and actually talk to the store manager or the club manager and go through a report that says here’s is how you did yesterday, here’s how the stores around you did, look at how you’re performing versus how many (inaudible), how many sales you had. We generate reports for the stores. So, there’s a high integration really from the very top to the very connection in the store and that’s really how we work to drive penetration.”[6] (Emphasis added.)
Average contract lengths are 7-10 years with 5-7 year extensions which are usually negotiated well in advance of the contract expiring. Contract renewals are usually less focused on price and more on how the companies can cooperate to maximise top-line growth. SYF has an average relationship of 11 years with its current partners and Dillards is the only sizeable contract that has been lost in recent years. Merchants representing 92% of A/R are under contract to 2019 and beyond.
As a result, the probability of a competitor stealing a significant percentage of their current merchants is very low.
- Growth
As discussed, growth via new wins is unlikely. Most growth will come via increased penetration of existing merchant-partners. SYF does not disclose penetration rates other than to say it can be as high as 40% of sale or as low as 1%. Given the incentives driving retailers to shift more sales to the PLCC and the rewards available to consumers, I think SYF’s purchase volume will continue to grow faster than the market as a whole.
Over the last 5 years, SYF’s loan balance has grown at a 9% CAGR. Given the under-penetration at most of the retailers and the compelling value proposition, I think it is reasonable to assume a 7% CAGR over the next 10 years.
- Credit Risk
As I have written about many times before, the main risk in any lending business is underwriting discipline. The risk here is that poor underwriting is being obscured by an unusually good credit environment. Net charge offs and provisions are currently at cyclically low levels, while the NIM is at record high levels. But, when the cycle turns, the loss provision will rise quickly, offsetting any top-line growth, eventually followed by a slowdown in top-line growth and a pick-up in net charge offs.
Without being intimately familiar with the company, it is difficult to know if the benign credit market is masking underlying problems. However, a review of the company’s performance in 2009 is somewhat reassuring.
Summary P&L, 2009 vs. 2015
| 2009 | 2015 | |
| Interest Income | 4,636 | 13,228 |
| Interest Expense | (830) | (1,135) |
| RSA | (799) | (2,738) |
| RSA as % of Loan Balance | 1.6% | 4.41% |
| Provision for Loan Losses | (2,883) | (2,952) |
| Other Income | 2,550 | 392 |
| Operating Expenses | (1,979) | (3,264) |
| IBT | 695 | 3,531 |
As you can see, while the performance wasn’t great, the company did remain profitable. Further, SYF was able to eke out a 1% after-tax ROA in 2009.
One key counter-cyclical buffer SYF has is the RSAs. As interest income declines, below certain thresholds, SYF’s payout’s to the retailers also decline. As you can see from the table above, the RSA as a percentage of average receivables was just 1.6% of average loan receivables in 2009, compared to 4.41% in 2015. Thus, if losses start to increase, the RSA acts as a mechanism to maintain profitability.
Further, since the crisis, SYF has taken substantial steps to tighten its underwriting.
Key Credit Quality Metrics, 2009 vs. 2015
| 2009 | 2015 | |
| % of FICO Scores Under 660* | 40% | 27% |
| 30+ days past due as a % of period-end loan receivables | 8.25% | 4.06% |
| Net charge-offs as a % of average loan receivables | 11.26% | 4.33% |
*A FICO score of 660 is generally viewed as the subprime threshold.
Despites these safeguards in the SYF system, I consider the risk of a significant deterioration in loan performance to be very high. In my model, I assumed an average charge-off rate of 5.3%. This is significantly below the 2009-2015 average of 6.4% and well below the 2009 charge-off rate. If the charge-off rate did revert to the historical average, loan growth would have to be 8%% to compensate – even assuming RSAs drop to 3.5% of loans receivable. I do not consider this likely. The market seems to expect the current benign credit market to continue for the foreseeable future.
- Liquidity Risk
SYF has, since the last cycle, improved its position by diversifying its credit sources to avoid a liquidity crunch. As stated above, 64% of SYF’s funds are provided by bank deposits. Deposits are a much better source of funding than conventional debt, especially short term debt. Deposits are a stable form of funding and, even better, deposits tend to increase a lot in financial crises because people want to conserve cash. Banks that rely on deposits for most of their funding are very safe. They won’t have a liquidity problem even if they incur some loan losses.
As a result, I consider the risk of a liquidity crisis hitting SYF to be very low.
- Technological Disruption
In addition to credit risk, the market seems most concerned with the risk of serious technological disruption hitting the payments industry. I have identified three scenarios for how the disruption could play out:
- Consolidation
- ]Fragmentation
- Displacement
Scenario #1 – Consolidation
In this scenario, the credit card industry consolidates around a few big issuers. As more and more commerce moves to mobile and online, payment is pushed to the back of the customer’s mind. Consumers load their credit card into, say Amazon.com or Uber’s app, and then don’t think about it. Simple inertia, therefore, has the potential to create a huge advantage for incumbents. Niche operators like SYF would be frozen out.
I think the odds of this scenario playing out are 10%.
Scenario #2 – Fragmentation
In this scenario, the payments market moves away from the “one size fits all” payment solution. Instead, consumers will use whatever payment mode delivers the greatest benefits, such as rewards, convenience or speed, at that time. The technology that will enable this is the digital wallet. The adoption of digital wallets will free consumers from physical limitations on the number of cards they can carry, allowing niche cards to gain popularity, particularly in geographies where customers are value conscious. As a result, owning and using multiple payment cards will no longer hinder the delivery of a seamless customer experience, prompting further proliferation of niche / merchant-issued cards.
I think the odds of this scenario playing out are 50%
Scenario #3 – Displacement – The death of the credit card?
Over the past 50 years, consumers steadily migrated from payment via cash and checks to greater use of cards. Will this trend continue or will innovative alternatives to cards capture more of the market?
One such innovative alternative is Affirm. Affirm is a point-of-sale lending solution. That is, Affirm provides online financing to consumers at checkout without the need for a credit card. Obviously, Affirm poses a threat to SYF’s business model. However, I think the probability of Affirm or any other company taking significant market share from SYF and the other credit card issuers is low.
I will quote here at length from a fellow blogger, Scuttlebutt Investor. He did an excellent job of articulating the argument against displacement:
“The death of the credit card has been greatly exaggerated. There have been numerous digital payments technologies (like digital wallets, PayPal, Google Wallet, etc.) that have been introduced over the last several years. However, most of these new solutions have not been runaway successes as predicted, mainly because they are trying to solve a problem that doesn’t exist. Credit cards are here to stay for three compelling reasons:
- Credit cards are incredibly easy to use, fairly easy to carry and very secure for the most part. They have only become easier to use over the last 5-10 years, as signatures are no longer required for most purchases and nearly every card provides fraud protection. So consumers will continue to use credit cards for a long time to come
- Many digital payments solutions still use credit cards on the backend. In other words, many digital payments link back to credit cards or debit cards to actually facilitate the payments and merely provide a user-friendly front-end experience. In this case, V and MA still make their cut. As I expected, we have seen this most recently with Apple’s new payment solution – Apple Pay. Both V and MA (and American Express) make still make their cut from this platform. There are some solutions like PayPal that have a bifurcated approach – they link to credit/debit cards but also directly to bank accounts. In the latter case, V and MA don’t make a cut. However, I am not convinced that PayPal or similar solutions will be taking significant share away from card-based payments in the near term.
- Issuers have done a great job at creating strong incentives to continue to use credit cards – i.e. airline mileage cards and rewards cards. So while consumers may make some purchases through PayPal here and there, the majority of their purchases (and especially the larger ones) will be relegated to a card.[7]”
For these reasons, I think there is a 33% chance innovation in the payments industry has a material impact on SYF’s business in the next 10 years.
Conclusion
The current market cap of SYF seems to reflect investor expectations that the current credit cycle has a while to run before it turns sour. In other words, the risk of the variables going against the company is not adequately reflected in the purchase price of the company. I prefer to buy when expectations are far lower. In sum, it does not seems as though the asset (shares of SYF) is significantly mispriced. I pass.
[1] Source: Charlie Munger’s 2015 Daily Journal Annual Meeting – Part 2
[2] How Bad Will It Get for American Express?
[3] Per Nilson Report via SYF Q4 2015 Investor Presentation.
[4] Q4 2015 Earnings Call.
[5] For example: “ As I said earlier, our biggest opportunity is still to grow organically.” Margaret Keane, SYF President & CEO, 2/22/16;
[6] Synchrony Financial at KBW Cards, Payments & Financial Technology Symposium, February 22, 2016.
[7] Scuttlebutt Investor, “The Toll Booth Businesses Of Visa And Mastercard”

Thanks for all the work that you put into this and your other blog posts. I view American Express (AXP) differently than you do. If you focus on the American private consumer– a la Costco– you’re focused on less than 1/3 of AXP’s earnings. Take a look at the “USCS” segment, and you’ll see perhaps half of that is corporate card spending. There’s also big chunks of corporate spending in AXP’s other segments. Indeed, Corporate card spending– in which AXP has a truly dominant position– is the heart of the company’s value. The market has hammered the stock by 45%, peak to trough. Even if you take the US consumer business to zero, there’s considerable value here. In the low 50’s (past few weeks), the market is valuing AXP as a well- below average company, even after accounting for the Costco loss. Seems like a buying opportunity to me; the corporate franchise is embedded and unimpaired.
Thank you for your thoughtful comments. I readily admit that I did not do a deep dive into the corporate segment. I was just fascinate by the shrinking moat on the consumer side. Perhaps, I should have stressed this.
I think you Amex analysis is incomplete. You now say the moat has cracked and the durability is gone. The loop doesn’t work like it did 2 years ago. I say, rubbish. I think the moat is pretty much the same as it was 2 years ago, and that is was never durable in the first place. 2 years ago exactly the same forces existed at the same intensity. Merchant discounts have been going down for a decade or so. PayPal and other fintech hype threats have been around for years, they started margining clearly about 7 years ago. Incidentally I think technology may be credit card/card network’s friends not enemy’s. E.g. Apple Pay will benefit Amex on balance relative to not having it. But the problem always was the model- Its more than twice as expensive to offer Amex than other credit cards for absolutely no benefit to the majority of retailers, if any really. You see its irrelevant that Amex card users spend more, because as long as the retailer accepts another card, there is no incentive for a card holder to stop shopping with a retailer if they won’t accept Amex. An anecdote (not evidence): I’ve had an Amex and MCD for about 15 years. I have never, NOT ONCE not gone to a restaurant I like, switched my electricity provider, not stayed at the best hotel I like, not bought the clothes I like, not shopped for the food I like, changed cable or phone providers, switched insurance companies or anything else because they have dropped Amex. Why on earth would any rational consumer forgo satisfaction of a good of their preference, or service at the best price, for the same of superior rewards at some future point. I have never understood why a consumer would reject a merchant for not accepting Amex at point of sale- its just not worth it in the majority of cases, if the same payment can be made on any number of other cards (sometimes with close even if not the same rewards). How many people would drive to another shop or stay at another hotel despite paying more for the room, being in the wrong location etc. etc. It is simply not in the consumers interest. Many Merchants charge higher surcharges for Amex- and then its not even a decision. In my country, Australia, there is no law preventing a merchant form charging more for Amex, many do. In the US, the legal issue has been around for many years. Its not about encouraging another card, its about charging more for a more expensive product. Amex doesn’t need to win the case to loose the battle. The loop was never strong. What may save Amex in the long term is if they transition their business to the same as MCD or Visa. I would do this quickly and in a big way. Visa/MCD are the largest networks and Amex could easily become just as large if they ditch their competitive Disadvantage and adopt the same network model- which is most certainly durable because it cannot be attached by merchants, the law, consumer preference or new payment forms. Its the network stupid. The network is king. The biggest network is the best network. Hurry up Amex, the faster you move, the bigger your network will be. It fact the more Amex commoditises its business then the bigger its moat will be. Ironic isn’t it! You see networks work because they are commodities, so efficient, ubiquitous and cheap that consumers and merchants don’t have an incentive to use another commodity, because its the same! The beauty of being a commodity network, like a commodity refiner of oil or chain or gas sellers is that once you are very where and your costs are low, then there is little point in a new entrant coming in. VISA and MCD are already there. If Amex becomes the real number three, then the three can exist in a harmonious structural oligopoly for decades to come. Thinking that it was not a commodity was the problem for Amex all along. Its ok to sell a commodity, some of the best businesses in the world sell commodities (not natural resources but easily substitutable products)- so long as there are few competitors selling them, and its hard to set up the distribution network (as in the payment processing industry) – then everything is fine. In fact Amex could easily become bigger than VISA, since it has the head start of issuing its own cards and being its own bank. But at the moment, this is not the business of Amex, and Amex is still too expensive to take on the risk that it many never move to this part of the field.
MCD is McDonald’s
“I have never, NOT ONCE not gone to a restaurant I like, switched my electricity provider, not stayed at the best hotel I like, not bought the clothes I like, not shopped for the food I like, changed cable or phone providers, switched insurance companies or anything else because they have dropped Amex.”
But you might if your corporate card was Amex. That’s another area where Amex has a good moat, especially now that Chase has dropped out of the large corporate card business.
Hi, thanks, very helpful.
As a European, where everybody uses debit cards (mostly Maestro), I find the stated interest rates and fees just mind-boggling.. why would any sane person borrow at those rates? After your article, I also see that it’s about connecting customers and retailers (brokerage/marketing). But still, I wonder what the added value is.
By the way, it would be helpful to introduce jargon abbreviations. I had to look up “SKU” and I still haven’t figured out what “RSA” is.
Thanks again.
Quite frankly, I have trouble understanding credit card debt as well. I can’t explain the psychology behind it. I use a credit card rather than a debit card simply for the rewards. I do not use the financing.
Point taken on the jargon. I will try to avoid it in the future.
“RSA” stands for Retailer Sales Arrangement. It is the profit sharing arrangement between SYF and the merchant-partner.
Here is the definition from the SYF annual report: Most of our Retail Card program agreements contain retailer share arrangements that provide for payments to our partner if the economic performance of the program exceeds a contractually-defined threshold. Economic performance for the purposes of these arrangements is typically measured based on agreed upon program revenues (including interest income and certain other income) less agreed upon program expenses (including interest expense, provision for loan losses, retailer payments and operating expenses). We may also provide additional economic benefits to our partners such as a signing bonus, royalties on purchase volume or payments for new accounts. All of these arrangements align our interests and provide an additional incentive to our partners to promote our credit products.
Good article. One thing I don’t understand is why you systematically ignore Chase and Discover and include BAML when discussing Amex’s competitors. Chase has by far the best Credit Card line up and is Amex’s main competitor. Discover is also pretty significant. BAML has a pretty awful card offering and isn’t a key player in this space.
I don’t think I spent a lot of time on any of AXP’s competitors, including BAC. My intent was not to do a deep dive on AXP.
This write up is thought provoking. Thanks for sharing.
You cited a JCP earnings call: “And obviously we get revenue from it and we do not have to pay Visa or MasterCard for that transaction.” Is this implying that V and MA don’t get any piece of a white label SYF card? If that is true, is there a reason V or MA wouldn’t compete directly with SYF or try to get a piece of the action? (Credit risk, etc.)
In a digital wallet world, who owns the data? Does the card issuer or the app own the data? How does that effect the value of SYF’s closed loop? (Data seems to be how the company intends to drive deeper penetration of its products.)
SYF’s provision for loan loss in 2015 was similar to their provision in 2009. Does that relatively constant level of provision concern you vis-a-vis the credit risk that SYF may be incurring?
Thanks again.
If you don’t know the players, the credit card world is very confusing. I ran through all the key players in the original AXP post. Long story short, V & MA are merely network operators. They do not offer credit, provide rewards, or issue cards. When a company like AXP or SYF operates a closed loop, that means the payment is processed over their own proprietary network and V & MA are not involved. The credit card issuers who partner with V & MA (BAC, Citi, JPM, etc) are certainly competing with SYF.
Good question on the digital wallet. This is a highly contentious issue. See: http://www.wsj.com/articles/SB10001424127887324557804578376442341437254
I am not sure where you are getting you loan loss provisions from. According to the filings, loan loss provision was 1,654 at end of 2009 and 3,497 at end of 2015. Further as percentage of loans outstanding, it was 7.22% at end of 2009 and 5.12% at end of 2015.
thanks for the write up, and update on your Amex output. Amex aside — (and I am a shareholder, and is convinced its a bit undervalued right now) — you’ve outlined some compelling argument for Synchrony financial.
it would be even awesome, if you actually indicated a price for SFY at which you’d see it as attractive.
Its a fair point. I would like to not lose my shirt if the the credit market turns – which I think is inevitable. In other words, its currently a P/E of 10 but on peak earnings. Assuming no buyback, if it dropped to $20 I would be happy.
Pingback: Big Profitable Airlines Paying No Income Tax at All and 1000 Free Miles - View from the Wing
Pingback: Some links | value and opportunity
Hi, this is a great post. Can you clarify how, exactly, SYF generates cash from their PLCC segment? Is it from late fees on payments from customers?
No, SYF generates most of their revenue from interest payments on credit card lending.
Seems like a strange business model… They want people consumer credit to be good enough for people to sign up for more cards, but at the same time want to collect interest on customer’s for being late?
I don’t think they want consumer credit to be good, They just want to be able to price default risk correctly
By the way, this business model has been around for thousands of years.