MLPs: Be Cautious When The Boring Is Made Exciting

Companies and industries that are out of favor tend to attract our interest.  While we focus on franchise businesses with large moats and good management at a reasonable price, investing in cyclical companies has a certain appeal.  After all, it seems straightforward enough that abrupt swings in market psychology will create bargains, even huge, screaming bargains.  If you can enter the market at the “point of maximum financial opportunity,” big money can be made.

cycle-of-market-emotions

Source:  Big Fat Purse

Continue reading

The Sam Hinkie Resignation Letter

Sam Hinkie’s resignation letter from the Philadelphia 76ers has been generating a great deal of discussion in value investing circles.  Partially this is because he refers to no less than 11 value investing heroes over the course of the 13 page letter – everyone from Buffett and Munger to Atul Gawande to Phil Tetlock.  Further, the tone and style of the letter will be familiar to regular readers of value investing tracts.  He borrows, among other things, the false modesty and tributes to the little people of Buffett’s annual letters[1] as well as the rational approach to decision-making from Farnam Street.[2]

But, to paraphrase Gertrude Stein, who will never earn a spot on value investing’s Mount Rushmore, is there any there there?  That is, when you look past all of the Howard Marks and Seth Klarman quotes and the tips of the cap to behavioral economics, does Hinkie’s letter have any real substance? Continue reading

Collectors Universe: The Poor Man’s Moody’s

Tags

, , ,

clct3

Collector’s Universe (CLCT) is the kind of company value investors profess to love.  After all, it ticks most of the boxes on a value investor’s checklist.  It is a microcap[1] with years and years of reliable cash flow.  It has a wide moat and provides a mission-critical service.  It has extremely high returns on capital, no debt and requires little cash to operate.

Over 19% of the company is owned by insiders.  Management has an extremely cautious approach to growth investments.  When no attractive investment opportunities present themselves, management distributes excess cash to the owners.

Continue reading

A Closer Look at Live Nation’s Acquisition Strategy

Back in March 2015, I wrote a blog post on Live Nation Entertainment (LYV).  This is my most popular post to-date.

I recently received an email from a reader who challenged LYV’s return on acquisitions.  This is a big issue as LYV has spent $565 million on acquisitions and related expenses over the past five years.  If they are engaging in value-destroying acquisitions, investors should be aware.

LYV discloses very little information on their acquisitions.  The most detail I could pull together is on the 2013 acquisition of 51% of Insomniac Events.  Insomniac puts on Electronic Dance Music (EDM) festivals and concerts, the largest of which is the Electric Daisy Carnival in Las Vegas.

But even here, the details are quite sketchy.  Even the acquisition price is difficult to pin down.  Media reports cited the acquisition price as anywhere form $40 million to $50 million.  At a March 10, 2015 investor conference, Michael Rapino, the CEO, said the purchase price was $40 million so I will go with that.

Further, although Insomniac put on multiple events in 2013, I can only find details on the concert they promoted in Las Vegas.

So, with that grain of salt, here is my model:

lYV M&A Model

We can quibble about my assumptions and the numbers forever, but let’s say this is directionally correct (If you don’t think it is directionally correct, please let me know).  LYV’s strategy therefore is to take a poorly monetized festival and immediately increase attendance by 20%, increase sponsorship by 300%, and move ticket sales to Ticketmaster.  This turns a money losing festival into something like $20 million of EBITDA by Year 2.  In isolation, this is nice but nothing special.  Absent any other moves, they would earn about 10% on this asset just by bringing scale and business acumen to bear.

But, the real juice comes in how LYV exploits the intellectual property it has acquired.  That is, the value of this acquisition goes beyond the cash flow generated by this single festival.  The acquisition included brands, goodwill, human capital, knowhow, customer list and other intangible assets.  LYV is uniquely positioned to fully exploit this IP globally.   LYV has the capital and the means to immediately expand the Electric Daisy Carnival brand name all over the world.

Accordingly, in 2016 Electric Daisy Carnival festivals will take place in Mexico City, New York City, Milton Keynes, United Kingdom and Tokyo in addition to Las Vegas.

This full model makes intuitive sense to me:

  1. Acquire 51% interest in a company with track record of drawing fans but not monetizing them properly.
  2. The founders of the acquired company retain a 49% share and continue to have a vested interest in its success.
  3. LYV immediately increases EBITDA at double digit rates by reducing expense through scale advantages, bringing in professional management and advertising and moving ticket sales to Ticketmaster.
  4. LYV then plugs the festival concept and brand into its distribution network and replicates the festival all over the world.

In a sense, this is similar to a multinational like IBM buying a high-tech company that sells its products in, say, 3 countries.  IBM can immediately deploy the products throughout its distribution system, giving the company a presence in 130 countries.  This gives an immediate boost to sales and income with little incremental expense.

Of course, this assumes that there are synergies at work when LYV makes an acquisition – a concept that comes perilously close to the Platform Value idea I poked fun at here.  However, I think there are a couple of differences.  First, LYV is doing acquisitions at a much slower rate than these platform companies.  Second, LYV’s acquired companies often maintain a great deal of autonomy so there is no pressure around integrating the company into LYV. This avoids the cultural conflicts that arise around acquisitions.

Beyond these considerations, I do think that there is far less risk of poor capital allocation in a company in the John Malone Empire.  Malone deserves deference as a capital allocator.  Perhaps you see this blind faith as naive, and maybe it is.  But he certainly has an impressive and long track record.

“Welcome to Adult Life”: American Express, Synchrony Financial & the Changing Credit Card Landscape

Tags

, , , , , , , ,

Two years ago, I investigated the moat around American Express’s (AXP) business.  I assessed the moat as wide and identified a positive feedback loop at the heart of it.  The loop ran like this:

  1. Spending on Amex cards is higher on a per-card basis than its competitors
  2. Merchants want to accept the Amex card to attract these high-paying customers
  3. This affluent customer pool enables Amex to charge higher discount rates
  4. Because of the revenues generated from higher-spending Cardmembers, Amex has the cash to invest in more attractive rewards and other benefits to Cardmembers
  5. The rewards program in turn creates incentives for Cardmembers to spend more on their Cards.

SYF1

This feedback loop was supported by a mutually reinforcing set of features of the business model:  the closed-loop system, the prestige brand image, a spend-centric focus rather than lend-centric, etc.  The whole model held together beautifully – until it didn’t.

On February 12, 2015, AXP announced that its 16 year relationship with Costco had ended.  Shares of AXP have dropped 24% since that time.

The event triggered the following exchange between a shareholder and Charlie Munger  and Gerald Salzman of the Daily Journal Corporation:

Q: I’d like to get your thoughts on American Express [AMEX]. Do you think its moat has narrowed recently?

Mr. Munger: I don’t think it was desirable that it lost its contract with Costco [COST]. Again, that’s an example of what tough capitalism is. Obviously, other people are willing to do it cheaper. It just shows how tough a position that looks impregnable can be in modern capitalism. It’s what makes everything difficult.

To those who already have some money, I think that’s just the way it is, and American Express has had a long period of very extreme achievement and prosperity. I think they’ll have a lot of prosperity in the future, but it doesn’t look quite as easy as it once did. Now, the head guy would say it’s always been hard, he’s been battling hard, but we paddled hard here too, and what good did it do us in Daily Journal’s print business? We paddled like crazy, didn’t we Gerry?

Mr. Salzman: We tried. It was hard.

Mr. Munger: Yeah, what happened is you just keep receding and receding. Welcome to adult life.  (emphasis added)[1]

Amex had one of the most durable business models ever designed.  Could the good times be over? Continue reading

Reconsidering OnDeck & Data Network Effects

In my post on OnDeck (ONDK) I included the collection of user data as key competitive advantage.

Specifically, I thought ONDK benefited from “data network effects.”  What are data network effects?  As an online platform (such as ONDK< Google, Facebook, Amazon, Pinterest or Twitter) achieves scale and gains users, it acquires more data.  This data leads to product improvement, which leads to more users and, subsequently, more data.  The process repeats.  According to some, this dynamic leads to an unbreakable positive feedback loop that makes effective competition impossible.  In fact, I included this chart illustrating the data network effect feedback loop:

Image 7

I bought this line of thinking without much scrutiny.  Since then, I have reconsidered the basic premise.  At issue is whether the collection of large amounts of data—sometimes referred to as “big data”—and in particular, data collected from users, can lead to markets “tipping” to dominant online platforms. In other words, does the accumulation of data by Internet companies create a moat because new entrants will not be able to compete effectively with the first mover in the marketplace?  Continue reading

An Ephemeral Form of Value: Thoughts on the 2015 Pershing Square Investor Letter

The 2015 annual letter from Bill Ackman’s Pershing Square makes for some interesting reading.  After seeing his fund decline by 20.5% in 2015 versus a 1.4% increase for the S&P 500, Ackman is prompted to undertake an assessment of what went wrong in the letter.  What conclusion does this Master of the Universe draw?  Well, Ackmans spends about a page on his own firm’s errors and about 7 on outside forces that combined to create the underperformance.  Perhaps this 7/1 ratio is completely appropriate, but it’s amusing nonetheless and gibes nicely with my image of him.

Anyway, the most interesting part of the letter is the two unforced errors he admits to committing. Continue reading

Time Warner (TWX): A Compelling Short?

There is an interesting short thesis for Time Warner Inc. (TWX) on VIC.

The author lays out one potential scenario for the outcome of competition between the cable networks and the OTT providers.  He sees the cable networks as obsolete dinosaurs and the OTT providers emerging as the clear winners.

The author’s central thesis is that the cable networks primary role as aggregators of contet has been overtaken by the OTT providers. Continue reading

OnDeck Capital (ONDK) & The Re-Engineering of Small Business Lending

Tags

, , , , , ,

Jamie Dimon, the chief executive of JPMorgan Chase, warned in his 2014 annual shareholder letter in 2015 that “Silicon Valley is coming” for banking’s bread and butter. It was a pivotal moment, because traditional banks are deep-pocketed monsters with large branch networks, huge marketing budgets and many years of underwriting experience.  Could  one of these Silicon Valley companies, OnDeck (ONDK) really take on these behemoths? To put the size difference in perspective, Chase spent $2.5 billion on marketing in 2014.  ONDK had $73 million of net revenue.  Chase extended $1.7 billion in business banking loans in the third quarter.  ONDK has originated $3 billion loans in its lifetime.   Was Dimon really concerned that they could cross the moat of regulation, longstanding customer relationships, marketing muscle, implicit government guarantee and deep pockets?

Just a year later, Dimon was forced to raise the white flag over Castle JPM and surrender to the forces of FinTech.  On December 1, 2015, On Deck Capital, Inc. (ONDK) confirmed that it is working with JPM on a strategic partnership.   JPM will use the Company’s small business lending platform to originate, underwrite and service loans to small businesses.   ONDK will get fees to originate and service loans for Chase, many with a value up to $250,000, previously considered too small to move the needle at the big bank. OnDeck also can use data it gleans from the partnership to improve its data models.

While I typically prefer tried and true businesses to glamorous and fast-growing Internet companies, I found this company and its model interesting enough to do a deeper dive.  In particular, I am impressed by ONDK’s ability to benefit from network effects.

What Does ONDK Do?

ONDK is an online lending portal for small businesses.

ONDK has four models for originating loans.

  1. Originate & Retain – ONDK has large warehouse facilities at reasonable rates. These funds allow ONDK to originate and retain most of the loans originated.  ONDK has first loss position on all bank facilities
  2. Originate & Securitize – ONDK also securitizes their loans. ONDK retains a 5% first loss risk position on all securitizations.
  3. Originate & Sell – 35-40% of loans are sold at a premium to institutional investors via the OnDeck Marketplace.
  4. Software as a Service – In the arrangement with JPM, ONDK will be acting as a software as a service provider. It will originate and service loans but it will provide no funds and it will take no credit risk.

ONDK’s median business customer has been in business 7 years, has a physical location and has $600,000 in annual revenue.[1]

The three most common uses of OnDeck credit are the purchase of inventory, employee hiring and retention, and the acquisition of new business equipment.[2]  The loans fall somewhere between a long-term loan from a traditional bank and credit card debt.

Nearly all the debt held on ONDK’s balance sheet is non-recourse.  Many of these loans operate similarly to a merchant cash advance, with a fixed amount or percent of sales deducted daily from the borrower’s bank account over several months.  Given the short loan terms, the rate a small business borrower could pay on an annualized basis is a median of about 50 percent at ONDK for a business term loan, but can range anywhere from 30 percent to 120 percent, with average loans of about $40,000.

ONDK gets customers through three channels:  direct marketing, strategic partners (banks, technology companies and companies serving small businesses) and brokers.  ONDK is de-emphasizing the broker channel after getting in bed with some unsavory characters.  (See Chart 1).

Chart 1

Image 1

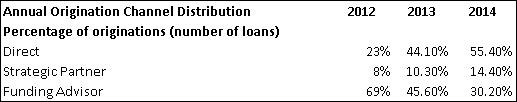
Source: 10-Ks via sentieo.com

Total Addressable Market

The total addressable market seems sizable.  There are estimated to be $800 billion of small business loans in the US.  ONDK targets loans under $250,000.  According to the FDIC, there were $186 billion of loans in this segment in Q2 2015.  In any case, with just $1.7 billion of originations in the last 12 months, ONDK would seem to have a long runway ahead of it.

Competitive Landscape

The competitive landscape has been stable for decades but is in a state of flux.  The traditional banks dominate the market but are not serving it well.

The primary problem is that unit economics do not allow them to offer the small, short term loans that small businesses need.  The cost structure of traditional bank – which include an extensive branch network, in person meetings, a costly staff of loan officers – is supported by the relatively large size of the loans they offer.  The unit economics break down at smaller loan amounts.  For the traditional banks, the cost of processing a $100,000 loan is the same as processing a $1,000,000 loan.  As a result, small business loans are generally not worth the trouble.

Second, traditional banks have not developed an underwriting process tailored to small businesses.  Wide heterogeneity, high failure rates, and varying use of borrowed funds make it hard to develop general standards.  There is no widely-accepted credit score for small businesses. Rather than devoting resources to solving this problem, traditional lenders simply rely upon the small business owner’s FICO score as a primary indicator of the business’s creditworthiness, even though it is not necessarily indicative of the business’s credit profile. As a result, traditional banks use a long, time-consuming loan application process that takes on average 33 hours to complete.[3] This is a non-starter for time and resource constrained small business owners.

Small businesses whose needs are not being met by traditional bank loans resort to a fragmented landscape of products, including merchant cash advances, credit cards, receivables factoring, equipment leases and home equity lines, each of which comes with its own challenges and limitations.

Alternative online lenders, including ONDK< have rushed to fill this niche.  The online loan market is very small but growing fast.

Online lenders fall into seven broad categories (see Chart 2) :

  1. Traditional balance sheet lenders: These firms lend out their own and retain the loans on their balance sheet.
  2. Marketplaces: Marketplace lenders provide a platform where lenders and borrowers can meet.  The marketplaces add value through the matchmaking process, credit risk assessment, pricing and loan servicing
  3. Crowdsourced Platforms: Crowdsourced platforms facilitate equity funding
  4. Aggregators: Aggregators allow borrowers to comparison shop a range of loan products which are offered from a variety of sources.  The value added is the reduction of search costs.
  5. B2B Invoicers: These firms help small businesses with the invoicing process.  This puts them in a position to understand these businesses cash flow patterns and suitability for short-term loans.  Because of this access to data, many are now adding lending to their bundle of services.
  6. Payment Networks & E-Commerce Platforms – These companies also enjoy privileged access to data making the underwriting process much easier. As a result, these companies are also offering short-term financing to their customers.

As described above, ONDK is a bit of a hybrid, falling into both category #1 and #2.

Chart 2

Image 2

Source:  Oliver Wyman & QED Investors, “The Brave 100:  The Battle for Supremacy in Small Business Lending”

The Online Lenders’ Strategy

“Disruption” is an overused word, but it certainly seems to apply here.  The online lenders have a four-pronged strategy in their asymmetric battle against the traditional banks.

The first prong is a data-driven approach to underwriting.  The online lenders reject use of the FICO score.  Instead, the online lenders tailor their underwriting approach to this market segment.  They take into account information from a wide range of sources including data on online banking, accounting, bookkeeping, credit card, shipping, supplier, and social media.  For example, ONDK’s automated model pulls from more than 100 external data sources, and analyzes more than 2,000 data points per application.  This approach has greatly expanded small business access to credit.

ONDK claims their model eliminates is 90% accurate at a 40% acceptance rate while pure FICO can only achieve 40% accuracy with a 20% acceptance rate.  In other words, they can enter into twice the number of loans as a FICO based system with the same level of risk.

Improved User Experience

As we have come to expect from Silicon Valley innovators, the online lenders have developed user friendly sites and apps.  The online lenders focus on creating clean, simple and friction-free application processes.  Much of the data collection process is automated.  An application can be submitted in minutes and an approval decision and money transfer can happen the same day.

Lower Cost Structure

These online lenders can target smaller loans in an economically favorable way, enabling them to serve a generally under-banked segment of the market.  Unlike the traditional banks, the unit economics allow online lenders to profitably make small, short duration loans.  They also offer automated daily and weekly collection services.

Regulatory Advantage

These lenders are not currently directly regulated by the FDIC or the CFPB, allowing greater flexibility in offering different rates to different types of borrowers, thereby creating additional efficiencies.

What Makes ONDK Stick Out from the Crowd?  Sources of Competitive Advantage

Data Network Effects

First and foremost, ONDK benefits from a particular type of network effects, data network effects.  As I have written about previously, a network effect occurs when the value of a product or service goes up with the number of people using it.  The classic example of network effects is the telephone.  As more people bought telephones, the greater the likelihood you could reach someone which made the product increasingly valuable.

A less well understood type of network effects is data network effects.  Matt Turk, a venture capitalist, recently described the concept of data network effects on his blog:

Data network effects occur when your product, generally powered by machine learning, becomes smarter as it gets more data from your users.  In other words:  the more users use your product, the more data they contribute; the more data they contribute, the smarter your product becomes (which can mean anything from core performance improvements to predictions, recommendations, personalization, etc. ); the smarter your product is, the better it serves your users and the more likely they are to come back often and contribute more data – and so on and so forth.  Over time, your business becomes deeply and increasingly entrenched, as nobody can serve users as well.[4]  (Emphasis in original)

In essence, a feedback loop is created that is difficult to disrupt.  This feedback loop leads to the winner takes all outcome we see so often industries based on algorithms.  This is how Google came to dominate Internet search.  “The more people searched, the more data they gave Google to make its index better, smarter, faster, and, eventually, more personal. In short: as Google got bigger, it got better, which made it bigger still. Google is a winner that has taken it all.”

Chart 3, The Data Network Effects Feedback Loop

Image 7

ONDK’s core business benefits from data network effects in several different and mutually reinforcing ways.

First, ONDK’s underwriting process is a classic example of data network effects at work:  the more small businesses use the platform, the more data points they provide, enabling ONDK to refine and improve its ability to assess credit risk.  This phenomenon creates a powerful competitive advantage.  ONDK’sc credit models get better the more it lends and if it is lending more than their competitors in a given year, they should be getting better faster. There are “major benefits to the credit model at scale in terms of the data you have collected, the amount of lending outcomes you have observed. so you can take more intelligently informed risks, maybe, than a smaller computing platform could.”[5]

A new entrant to the industry is far behind ONDK.  “And the thing about lending is you can’t go from zero to 60 overnight. You have to lend and learn. It’s an iterative process. And what we know is that there is substantial advantages that go to the scaled player.  So if OnDeck is the leading originations volume player in the space, that means we’re going to learn more from that set of originations this year than a competitor who was lending at 1/10 the volume. We are probably collecting 10 times the data.”

Further the improved risk assessment via the OnDeck Score as well as the short term loans allows ONDK to expand access to credit.  ONDK is able to help borrowers that the traditional banks or even some online lenders would reject out of hand.

Additionally, the superior underwriting process allows ONDK to streamline and automate loan applications, expedite underwriting and quickly price risk, and provide loan applicants with quick loan decisions and access to funds.  Estimates show that applications at these creditors take as little as 1/50th the time to complete of those at traditional banks.[6] Reports suggest that some borrowers are willing to pay a higher price in exchange for an easy application process, a quick decision, and rapid availability of funds.[7] All of this is summed up by ONDK’s net promoter score of 75.

Similarly, as ONDK collects more data on its customers, its customer acquisition cost declines.  A key scale benefit for ONDK is reduced customer acquisition cost.  ONDK mainly uses direct response marketing, a highly measurable form of advertising.  As they gain more experience, the marketing becomes more highly targeted and, therefore, more cost effective – increasing the gap between ONDK and its competitors.

Additional Scale Advantages

As most of my readers know, economies of scale exist when the unit cost of a product goes down as the volume of production goes up. Therefore, it is cheaper to make cars in factories that produce 300,000 cars per year than make them in factories that produce 2,000, and this is true even if the cars are basically identical.

A technology company like ONDK is highly scalable.  Once the IT is in place and algorithm created, the marginal cost of processing a new borrower is extremely low.  Accordingly, operating expense as a percentage of loans dropped from 12% in 2012 to 3% over the last 12 months.

ONDK’s scale also results in a reduced cost of capital.  Breslow described the dynamic at an investor conference:  “ When you look at cost of capital, that is also a game of scale, and bigger institutional lenders can offer you lower rates, but they are not going to do that unless there is enough capital to put to work on a scaled-up platform.”  This leads to lower rates on borrower side.

Switching Costs

As discussed above, ONDK grabs the small business customer early in the business lifecycle when traditional banks and other lenders have the most trouble assessing the credit risk and when the dollar amounts are small.    “So I think our opportunity really is we think we can underwrite a small business earlier in its lifecycle than any traditional bank can. So if you are two, three years in business, you’re just starting out, OnDeck should be able to work with you before a lot of our competitors can because we understand that incremental risk and we can underwrite that risk better than others.”[8]

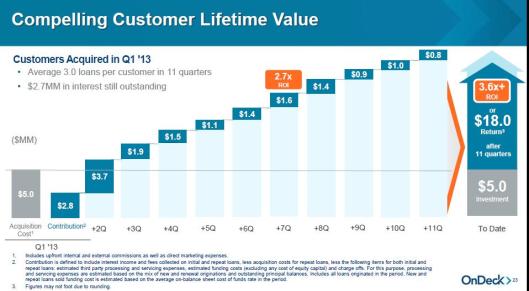
Then, once they are in the door and the customer acquisition cost has already been incurred, ONDK strategy is to provide them with more loans. How? ONDK creates switching costs through its loyalty program.  Under the loyalty program, for repeat customers origination fees are generally reduced or waived and interest rates are lower.

The lifetime value of these repeat customers is very high.  The incremental costs of each additional loan are quite low as the customer acquisition cost is dramatically reduced on each successive loan.  (See Chart 4.)

Chart 4

Image 4

Brand

ONDK has become the go-to partner for banks looking to better serve this market.  (See Chart 5.)

Chart 5

Image 6

Source: Forms 10-K via Sentieo.com

How Will This Play Out Over the Next 10 Years?

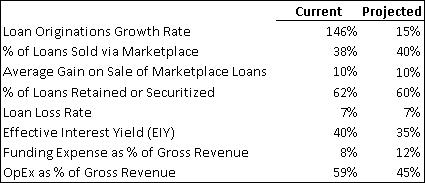
Over the trailing 12 months, ONDK earned $4 million of operating income.  To hit my hurdle rate of 15% per year, ONDK will have to earn operating income of $140 million in 2025.  Using fairly conservative assumptions, I can get ONDK to hit this goal.  My assumptions:

The most difficult assumption is the growth rate of originations.  Yet, even at a 15% CAGR, the total loans projected to be originated in 2025 are just $7 billion.  This is a small fraction of the total small business lending market, even assuming no growth in access to credit.  As stated earlier, the total market for small business loans under $250,000, ONDK’s targeted segment, is estimated to be $186 billion.

What other outcomes are plausible?  What could disrupt this projection? What is the likelihood that they occur?

Scenario #1 – The Traditional Banks Launch a Successful Counter-Offensive

In scenario #1, the traditional banks successfully beat back competition from ONDK.  This seems highly unlikely.

Faced with competition from online lenders, traditional banks options are left with three options:   (1) continue the status quo of simply ignoring small value loans, (2) build their own platforms, underwriting models, etc to handle small loans, or (3) partner with someone like OnDeck.

The traditional banks are fat, dumb and happy.  They largely rely on the simple fact that every small business in the country has a checking account.  This gives them a natural entrée to any company considering a loan.  When combined with their marketing muscle, their branch network and share of mind, they have little incentive to change their way of doing business.

It will be easier to partner with OnDeck.  OnDeck has built a machine.  There is no sense in trying to re-create what OnDeck has done.  Even if a bank tried to recreate OnDeck, they would struggle to get the data that OnDeck has – since OnDeck has many partners.  Even if they had the data, there is an a question of how to underwrite using that data – which is nontrivial.

The JPM partnership deal indicates that the financial services industry has accepted the new reality and is adjusting accordingly.  They realize that it is a fight that is unwinnable.

Scenario #2 – Competition from Other Online Lenders

In scenario #2, competitors are drawn to the market by ONDK’s high return.  Increased competition reduces returns on capital for all participants to the cost of capital.  I see this as somewhat likely.

Despite the competitive advantages described above, ONDK still has its vulnerabilities.  There will likely be other winners.  Some firms occupy a fortuitous position whereby their main business gives them privileged access to data on a firm’s cash flow and an advantage in pricing risk.  American Express Merchant Financing has been successful for Amex, extending short-term financing to businesses that accept American Express cards and that have significant Amex-specific charge volumes. Similarly, Square has terrific data on their customers, and will be in the best position to offer their customers small dollar financing for inventory, etc.  Same for Amazon.  OnDeck can’t compete for those customers.  As a result, ONDK needs to target a niche within a niche.  OnDeck’s sweet spot is small business with a physical presence – plumber, landscaper, restaurant, etc.

Nevertheless, there is also some chance the market could tip to a winner takes all scenario.  As discussed above, many Silicon Valley companies have emerged as monopolists due to network data effects and other scale advantages.[9]  As companies get bigger, they get better, which makes it better still.  Once a company emerges as the leader in a market, it is difficult to slow their momentum.

I think the likelihood of a tipping point is low due to the presence of these competitors with privileged access to data.  But, the probability is somewhere north of zero and the reward is huge.

Scenario #3 – Self-Inflicted Wounds

Perhaps the great risk comes not from competition but from self-inflicted wounds.  Nothing is more commodity-like than a loan.  As competition proliferates, what will stop borrowers from simply shopping for the lowest rate and the loosest underwriting?  ONDK’s interest rates are quite high, averaging ~40%.   These rates provide plenty of room for competition to undercut them.

How will ONDK respond?  Will they water down underwriting standards in order to maintain topline growth?

A commitment to maintaining high underwriting standards has proved difficult for financial services time and time again.  Because one loan is indistinguishable from another, one common way to gain market share is to simply reduce underwriting standards.  A deadly combination emerges:  risk tolerance increases as interest rates go down.  This dynamic has brought down many companies.  The only solution if risk tolerance is high in the marketplace is to walk away from potential business.

But, while simple on paper, it is very difficult for companies to knowingly turn down business and contract rather than grow.  Warren Buffett has written about this risk many times in the auto insurance (GEICO) context.  Buffett refers to the impulse to grow even if it means increasing risk as the “institutional imperative.”  “Most American businesses harbor an ‘institutional imperative’ that rejects extended decreases in volume,” Buffett writes. “What CEO wants to report to his shareholders that not only did business contract this year but that it will continue to drop?.”[10]

While every lending business would like to believe it makes loans only after applying strict underwriting criteria, it is hard to avoid the siren song of growth, especially for publicly traded carriers that have to worry about Wall Street.

The institutional imperative has such a strong pull that restraints must be put in place to avoid reckless loans.

One corrective is to incentivize employees to maintain underwriting discipline.  For example, employees can be assured that no layoffs will take place if risk tolerance in the market increases and the company finds it best to walk away from new business. Otherwise, employees will rationalize inadequate pricing, telling themselves the poorly-priced business must be tolerated in order to avoid layoffs.  Accordingly, Berkshire does not engage in layoffs when there is a cyclical downturn at one of the insurance companies.  Buffett explained:  “This no-layoff practice is in our self-interest. Employees who fears that large layoffs will accompany sizable reductions in premium volume will understandably produce scads of business through thick and thin (mostly thin).”[11]

As is typical of most companies, ONDK provides no information on their layoff policy.  The business is not labor intensive.  I would like to think they would prefer excess overhead to sloppy underwriting.  Nevertheless, the financial metrics that executives are measured on are disappointing.  Per the most recent proxy they include:  overall financial performance, total units, new units and new products, development of OnDeck Marketplace and certain customer-related measures.  Unfortunately, these are largely measurements of growth with no view as to whether the growth is profitable or risky.

ONDK argues, however, that the short term nature of their loans means that a deterioration in quality will show up quickly and be corrected.  “So when you look at our business, you do see shorter terms than traditional bank loans, you do see more frequent collections methods than traditional bank loans.   And we think that creates valuable early warnings and protection for us if economic circumstances were to change.”[12]

Another restraint on the institutional imperative is so-called “skin in the game.”  That is, how much of the companies own capital is at risk?  The originate-to-sell model came under a great deal of criticism in the wake of the financial crisis.  The argument against this model was that loan originators cared little about the quality of loans because they knew the risk would land on someone else’s balance sheet.  Today, ONDK retains 60% of their loans.

I do agree with ONDK that the short term nature of the loans makes it easier to monitor loan performance and take corrective action if necessary.  Nevertheless, I do think the institutional imperative is a powerful force.  There is a 25% chance that ONDK will shoot themselves in the foot.

Scenario #4 – Regulatory Crackdown

I find it very difficult to forecast government actions.  Yet, it seems highly likely that as non-bank lenders become a bigger slice of the US economy, they will be subject to great regulatory scrutiny.  Indeed, the Treasury Department put out a request for information to these companies not too long ago.

ONDK seems to be taking the correct steps to preempt a regulatory crackdown.

For example, they have reduced their reliance on shady brokers for leads.  In 2012, 69% of originations came from funding advisors.  In Q3 2015, that number dropped to just 25%.   They are also moving toward lower risk customers that will produce less defaults and ugly collection scenarios.

Further, somewhat counter-intuitively, compliance expense actually benefits the scale player.  Compliance expense is a fixed cost that can be spread over more loans reducing the expense per loan.  Compliance expense also deters new entrants from entering the field.

Scenario #5 – The Next Credit Crisis

A fifth scenario is that the next credit crisis results in a large increase in defaults.  I consider this likely.

The OnDeck Score is untested in a recession.  My greatest fear is that the model is based on the recent past, an unprecedented period of benign credit markets.  Models based on an anomalous period will not perform well when the cycle turns.  For examples, the model used by underwriters, rating agencies and investors to estimate the probability of mortgage default was based on the history of credit default swaps, which unfortunately went back “less than a decade, a period when house prices soared.”[13]  These models failed miserably when housing prices dropped in 2008.

Further, ONDK’s loans will likely be hit harder than average in a downturn, since the businesses they are lending to are small and fragile.

As the Wall Street Journal stated, “In moving away from FICO, most of these online lenders are betting that their new scoring models aimed at expanding credit will hold up in a tougher business environment.”[14]  Only time will tell.

Scenario #5 – Rising Interest Rates

ONDK works on a very wide spread.  The average APR was over 40% in 2015. ONDK’s borrowing costs are around 5% all-in. So if rates move up 25 basis points, it doesn’t actually change the economics of the business all that much.

Conclusion

Value investors traditionally stay away from companies like ONDK for two reasons.  First, their model has not withstood the test of time.  Second, valuing fast growing companies is a challenge.  Many investors have gotten caught with their pants down by over-estimating growth.

Here, the first issue is very real.  We have no idea how ONDK’s underwriting will hold up through all phases of the credit cycle.  While the approach of management to this issue is reassuring, this issue requires more work.  Regarding the second issue, in my back of the envelope valuation calculation I have assumed a dramatically slower growth rate.

Finally, I think value investors are slow to appreciate the scale advantages that tech companies enjoy, particularly data network effects.


[1] OnDeck December 1, 2015 Investor Deck.

[2] OnDeck, Response to US Treasury Department Request for Information on Online Marketplace Lending and Expanding Small Business Access to Capital, 9/30/15

[3] Federal Reserve Bank of New York (2014), available at http://www.newyorkfed.org/smallbusiness/Spring2014/pdf/full-report.pdf.

[4] http://mattturck.com/2016/01/04/the-power-of-data-network-effects/

[5] Noah Breslow, 08.10.15 , Pacific Crest Global Technology Leadership Forum

[6] Entrepreneur, “Why Small Businesses Are Turning to Online Lenders,” April 15, 2015.

[7] http://www.federalreserve.gov/newsevents/speech/brainard20150930a.htm#f11

[8] On Deck Capital Inc at Goldman Sachs Financial Technology Conference September 10, 2015

[9] See e.g. Malik, Om (December 30, 2015), “In Silicon Valley Now, It’s Almost Always Winner Takes All,”  New Yorker.

[10] Buffett, Warren, 2004 Letter to Shareholders.

[11] Buffett, Warren, 1986 Letter to Shareholders.

[12] On Deck Capital Inc Earnings Conference Call , May 4, 2015

[13]  Salmon, Felix (2009-02-23). “Recipe for Disaster: The Formula That Killed Wall Street”. Wired.

[14] Rudegeair, Peter (2016-01-11). “Silicon Valley:  We Don’t Trust FICO Scores”.  Wall Street Journal.

Cable One:  A Starkly Different Approach to The US Cable Industry

Tags

, , ,

“In nature and in business, specialization is key.  Just as in an ecosystem, people who narrowly specialize can get terribly good at occupying some little niche.  Just as animals flourish in niches, similarly, people specialize in the business world – and get very good because they specialize – frequently find good economics that they wouldn’t get any other way. . .”

-Charlie Munger

On November 13, 2014, Graham Holdings Company (GHC) announced plans to spin off its cable subsidiary, Cable One (CABO).  On May 26, 2015, Charter Communications announced its intention to merge with TimeWarner Cable (TWC) and acquire Bright House Networks (BHN).

What did these announcements have in common other than the obvious link to the cable industry?  Some prominent figures in the value investing community were involved in both announcements.  John Malone’s Liberty Broadband owns 26% of Charter.  Donald Graham owns 4% of CABO and a majority interest of GHC.  A third CEO featured in The Outsiders, Warren Buffett owns 5% of Charter and 2.2% of GHC through Berkshire Hathaway.  Further, value investors Tom Gayner and Wally Weitz sit on the CABO board of directors.

Beyond that, the two companies have little in common.  Once the dust settles, New Charter will be a behemoth with 24 million customers and revenue of $36 billion.  CABO has just 687,000 customers and revenue of $814 million – barely 2% of the size of New Charter.

Similarly, Charter and Cable One present two very different visions of the cable industry.  Charter’s strategy is based on scale advantages and aggressive growth through acquisition.  CABO’s strategy, following Munger’s vision above, is based on a heightened focus on its unique customer segment and disciplined capital allocation.  Which company is more attractive for investors?  And what can the contrast between these two companies tell us about the industry?  Is cable an industry where specialization leads to good economics?  Or, is it an industry where scale drives success?

Cable One

Cable ONE, is a collection of small market cable systems focused on less competitive rural areas in the South and the West.  This segment of cable customers has lower household income and higher sensitivity to price than other segments.  CABO is the tenth largest cable system in the US based on 2014 revenue and customers.

Despite being a sub-scale rural cable system, CABO believes it can still generate steady cash flows and good returns on capital.  (See Figure 1.)  To achieve this, CABO rejects the Malone strategy based on massive economies of scale.  Given its customers base, it makes no sense for CABO to pursue the same strategy as Charter.

In its relentless focus on a niche market (rural broadband), CABO reminds me of a Michael Porter case study, Carmike Cinemas (CKEC).  Porter describes Carmike’s approach in his seminal article “What is Strategy?”:

Carmike Cinemas, for example, operates movie theaters exclusively in cities and towns with populations under 200,000. How does Carmike make money in markets that are not only small but also won’t support big-city ticket prices? It does so through a set of activities that results in a lean cost structure. Carmike’s small-town customers can be served through standardized, low-cost theater complexes requiring fewer screens and less sophisticated projection technology than big-city theaters. The company’s proprietary information system and management process eliminate the need for local administrative staff beyond a single theater manager.

Carmike also reaps advantages from centralized purchasing, lower rent and payroll costs (because of its locations), and rock-bottom corporate overhead of 2% (the industry average is 5%). Operating in small communities also allows Carmike to practice a highly personal form of marketing in which the theater manager knows patrons and promotes attendance through personal contacts. By being the dominant if not the only theater in its markets-the main competition is often the high school football team-Carmike is also able to get its pick of films and negotiate better terms with distributors.

Figure 1, More Than One Way To Skin a Cat, Returns on Invested Capital in the US Cable Industry, 2014

Figure 1

CABO’s Strategy

Like Carmike, CABO’s contrarian strategy is built around the unique circumstances of its customer base.  It has made the difficult trade-offs that constitute real strategy rather than trying to be all things to all people.

An Aggressive Turn Away From Video

First and foremost, CABO made the difficult decision to de-emphasize video and voice services.  While data is surpassing voice and video as a profit source for all cable companies, CABO alone is willing to raise prices and let the chips fall where they may.  Fundamentally, CABO does not believe traditional pay-tv can be profitable. (See Figure 2.)  Programming and retransmission costs simply chew up any profit.  Therefore, any attempt to maintain a video offering with the current economics is a misguided attempt to grab market share at the expense of profitability.  Even it made sense to offer video as a loss leader in the past, it makes no sense now as more and more homes are going broadband only.  Put simply, CABO has “declined to cross-subsidize our video business with cash flow from our higher growth, higher margin products. . . .”[1]

Figure 2

Figure 2

Source:  Cable One Investor Presentation

Accordingly, the number of video customers dropped by 25% from 2012 to 2014.  The number of more profitable HSD subscribers has grown over this period, albeit at a slower pace.  Opting to consciously shed customers puts CABO far outside the cable industry mainstream.  As the company stated:  “While this strategy runs contrary to conventional wisdom in the cable industry, which puts heavy emphasis on video customer counts and maximizing the number of PSUs per customer by bundling services, we believe it best positions us for long-term success.”[2]

CABO feels strongly enough about this pivot away from video that it can play hardball with programmers pushing through price increases and even walk away if they cannot reach an agreement.  CABO actually dropped Viacom and its bundle of channels after Viacom tried to push through a fee increase. “Cable ONE is really not pushed into a corner by increases in programmer pricing. We have shown, as we did in March with Viacom, that we are willing to drop people where we don’t think the value to our customers is equal to the money being demanded.”[3]  (Interestingly, on the Q2 earnings call, management reported that dropping Viacom cost them just 2% of video revenue.  This provides some evidence that Viacom might be a loser in the changing pay-TV landscape.)

Lifetime Value Approach to Customer Acquisition

A second facet of CABO’s strategy is a lifetime value approach to customers.  This is the anti-thesis of the Malone economies of scale approach.  Over the past three years, the company introduced rigorous analytics to determine the expected life-time value, or “LTV”, of current and potential residential customers. By focusing our sales, marketing and service efforts on residential customers with a high LTV, they significantly reshaped the customer pool. This has enabled CABO to earn higher profits with fewer customers and PSU subscriptions.   Reducing the number of low-LTV customers, significantly reduced churn, bad debt expense and other costs.

From 2011 to 2014, CABO experienced a 60% reduction in bad debt; a 21% reduction in the frequency of telephone customer service calls, resulting in a 21% headcount reduction in telephone customer service personnel; a decline of 21% in the frequency of technicians being dispatched to customer locations, resulting in a 13% headcount reduction in the staff devoted to that function; and an overall headcount reduction of 308, representing a reduction, primarily through attrition, of more than 13% of total workforce (now 2,022).

Low Cost Structure

Since implementing their LTV strategy in 2012, CABO has the lowest cost (operating expense plus capex) per customer in the industry and the second lowest cost per PSU.  (See Figures 3 & 4.)  It also maintains very competitive operating margins.  As the company explains, “This is the antithesis of normal cable economy-of-scale expectations, where higher volumes are expected to create lower costs per PSU and increase operating margins.”[4] Rather than increasing our size and seeking cost savings through economies of scale, they have achieved cost savings through operating efficiencies keyed to the unique characteristics of their market.

Figure 3, Cost Per PSU, 2010-2014

Figure 4

Figure 4, Cost Per Customer, 2010-2014

Figure 3

A Disciplined Approach to Capex

Unlike other cable companies which waste million on developing new technology,  CABO faces no pressure to make such investments in its market.  Instead, CABO is able to only introduce new technologies when they have proved themselves in bigger markets and are available on more favorable economic terms than typically paid by the earliest adopters.

In this way, CABO’s highly disciplined approach to capital allocation sounds a lot like the approach adopted by a young John Malone.  According to The Outsiders, Malone saw “no quantifiable benefit to improving his cable infrastructure unless it resulted in new revenues.  To him, the math was undeniably clear: if capital expenditures were lower, cash flow would be higher.  As a result, for years Malone steadfastly refused to upgrade his rural systems despite pleas from Wall Street.  As he once said in a candid aside, ‘These [rural systems] are our dregs and we will not attempt to rebuild them.’  This attitude was very different from that of the leaders of other cable companies who regularly trumpeted their extensive investments in new technologies.”[5]

Competition

CABO’s geographic market protects it from competition.  It is difficult for any private operator to justify overbuilding a fully upgraded fiber-optic cable network in a poorer, low population density area with an incumbent operator already present.

CABO does have DSL competition.  CABO estimates that 25% over built but this is largely DSL.  CABO is confident that its offering will win out over DSL.

Can CABO Grow?

I see a pretty clear road map for CABO to double unlevered, pre-tax FCF from 2014 to 2024.  The principle drivers are as follows:

  1. Margin expansion – OIBDA margins could expand by as much as 8 percentages points (37% to 45%) as low margin video and voice services drop off and high margin HSD and business services expand. I see HSD and business services increasing to 77% of revenue from 42% in 2014.  Clearly, 45% is a very high OIBDA.  Comcast currently has the highest OIBDA in the cable industry at 41%.  But, I think a 45% margin is realistic for CABO as they evolve into a monopoly provider of HSD services.  Margins increased from 34% in 2012 to 36% in 2014 and I expect this trend to continue for some time.
  2. Capex Normalization – Several capital-intensive initiatives are scheduled to wind down by the end of 2015. Accordingly, I have project industry average capex of 17% of revenue from 2016 forward.  This is down from 20% of revenue in 2015.
  3. Untapped Pricing Power – From 2012 to 2014, CABO’s residential HSD ARPU rose 5% without the benefit of raising prices.   Recently, after nearly five years without taking a rate increase, CABO announced that it will increase rates on residential data plans by $5.00 per month beginning with October 2015 billing statements.  Again, as a monopoly provider of HSD services, CABO should have a great deal of pricing power.  Accordingly, I forecast a 3% CAGR in HSD pricing.
  4. Increase in Penetration – CABO can increase penetration of their existing customer base. Their HSD penetration of homes passed is much lower than other cable systems creating a large upside opportunity.  (See Figure 5.)  I forecast a fairly modest 3% CAGR in retail HSD customer growth, increasing penetration to just 35%.[6]

Figure 5, Data Penetration of Homes Passed, 2014

Figure 5

  1. Unit Growth – I forecast a modest 1% annual growth in homes passed plus a 2% CAGR in residential HSD customers and 3% CAGR in business services customers.
  2. Revenue Growth – Drivers #3-#5 combine to produce an overall revenue CAGR of 3% as growth in data and business services offset drops in video (-6%) and voice (-24%).
  3. Expense Reduction – I assume no benefit from expense reduction creating the potential for an upside surprise.

What Is CABO Going To Do With All This Free Cash?

This rapid increase in free cash raises another question:  What is management going to do with all the cash?   CABO’s current high returns on capital will be eroded over time unless management can find reinvestment opportunities offering similar rates of return.  A company that can find plentiful reinvestment opportunities is a so-called “compounding machine.”  It will compound the value of its equity for many years to come and increase intrinsic value accordingly.  CABO does not seem to have many such reinvestment opportunities available to it.

Interestingly , Tom Gayner,  CIO at Markel and a director of CABO, stated that “a perfect business is one that earns very good returns on its capital, and can take that capital that it makes and then reinvest that and keep compounding at the same sort of a rate year after year after year.”[7]  He then goes on to state that “the second-best business in the world, is one that earns very good returns on capital. It can’t reinvest it, but the management knows that. They’re intellectually honest that they have to do something else with the money. And what are their choices?  Well, they can make acquisitions, they can pay dividends, they can buy their own stock. But they are thoughtful and they know that.”[8]  CABO would seem to fit clearly into this second category.

CABO management seems to have four options available for its cash.

Option #1 is, of course, allocating cash to investments that will have a return equal to or greater than the company’s current ROIC.  As Buffett put it, “A company’s management should first examine reinvestment possibilities offered by its current business – projects to become more efficient, expand territorially, extend and improve product lines or to otherwise widen the economic moat separating the company from its competitors.”[9]

CABO management seems to be reluctant to pursue this option as they should be.  In the past few years they have made substantial investments to improve the speed of its network.  Data speed is they factor separating CABO from its competitors.  With the moat widened already, there would seem to be few additional opportunities to invest funds at a 30% or greater return (CABO’s current ROIC).    One possibility is investing in fiber to the home.  But, installing fiber is very expensive with uncertain returns.  As stated earlier, given their less affluent nature of their market, it is best to err on the side of caution.

Option #2 is to use the cash for acquisitions, either bolt on acquisitions or acquisitions not directly related to the current business.  It has been well-documented that companies have spotty acquisition records at best.  Therefore, I was happy when I read that the CABO CEO saw limited M&A opportunities.  It is for the best.

The third option is to return the cash to shareholders via dividends.  Accordingly, CABO has announced a $6 per share dividend.  This will chew up about 19% of my estimate of 2016 FCF (OIBDA less capex).  This is certainly a worthwhile use of cash when there is a belief that shareholders have better options for investing the cash than management.  For example, See’s Candy has few investment opportunities.  As a result, the best use of See’s free cash is to send a check to Omaha where Buffett can invest it wisely.  I believe that a similar situation exists here.  I hope the dividend will increase annually and only cut very reluctantly.

The fourth option is to return the cash to shareholder via share repurchases.  While not sexy, aggressive share buy can have a dramatic impact on per share value.  On VIC, Cuyler1903  lays out a reasonable case for CABO repurchasing 27% of its shares outstanding by 2018.  He estimates that this would increase the share price to $563 – approximately a 33% increase over the price on September 2015.  Further, share repurchases signal to the market that management takes its capital allocation role seriously and will not fritter away earnings on silly diworsification efforts or misguided acquisitions.[10]

But, buy-backs are not an unadulterated good.  In his 2011 shareholder letter, laid out a two-prong test to determine whether a stock repurchase makes sense:

  • Does the company have ample funds to take care of the operational liquidity needs of its business?
  • Is the company’s stock selling at a material discount to the company’s intrinsic business value, conservatively calculated?

There is no doubt that CABO passes the first prong of the test.  CABO has announced that it will borrow up to 3-4 times EBITDA –  a more conservative position than Malone takes.  A cable company with strong cash flows should be able to support this level of debt without any problem.

The second prong of the test is more problematic.  Valuation matters.  Historically, managements tended to ramp up buybacks in bull markets, when stocks are most expensive, and to reduce them in bear markets, when shares sell at bargain prices.  (See Figure 6.)   And, as is the case with any investment, shares repurchases financed with debt can only make a bad situation worse if the economy or business sours.  The success of buybacks, like any investment decision, depends largely on the price paid. That’s why it’s important to consider the valuation of a company when assessing the quality of its buyback decisions. Companies that execute share repurchases, and that are attractively valued, deliver much better returns on average.

Figure 6

Source:  Woodford Funds

CABO is certainly not a screaming bargain by normal valuation metrics.  As of 9/22/15, it commands a trailing P/E of 18.14, a Price/Book of 6.02, a EV/EBITDA of 10.10 and an unlevered FCF yield of 5.38%.  Beyond these common yardsticks, even assuming a 9% growth rate over many years as I forecast, the company is not deeply under-valued.  Is this an appropriate time to undertake a buyback?  Is it possible that management knows something we do not?  Managements are human and full of human biases. But at least they are likely to know more about their own current business than about future investments.  Still, in most cases I would discount the enthusiasm of management.  But, as demonstrated above, at least one of the directors has thought long and hard about capital allocation and voted in favor of a $250MM stock buy-back program.  Given the pedigree of Gayner and the others, I am predisposed to listen to them.

Reinvestment Dynamics at Charter and CABO

The contrasting approaches to capital allocation at Charter and CABO are illuminating.

In de-emphasing video, is CABO skating to where the puck is going or are they turning their back on an important revenue stream?  Will they look like geniuses in a few years when OTT dominates video distribution?

Charter is willing to spend on capex and acquisitions and take on lots of debt.  It offers no dividend and no repurchase program.  Will Charter once again end up a company with an unsustainable debt load along with heavy capex spending, tiny margins, and low EBIT and sales growth?  Or will the promised synergies and economies of scale kick in and Malone will look like a genius?

To be sure, Charter’s acquisition of TWC and Bright House as well as their continuing high level of capex, represent an enormous bet on the future of cable.  An investment in CHTR takes a leap of faith that in the future that capex will come down and the company will generate significant FCF and returns on capital.  Given the track record of the principals, this seems like a reasonable bet.

CABO is a small cable system in a rural environment with less affluent customers.  Given this set of circumstances, it is unlikely that investments will be recouped.  Thus, in a slow growth scenario, it makes perfect sense to focus on operational efficiencies and return as much cash as possible to shareholders.

Nevertheless, as Gayner laid out above, all things being equal, the opportunity to own a “compounding machine” is more attractive.  As Warren Buffett wrote:  “Leaving the question of price aside, the best business to own is one that over an extended period can employ large amounts of incremental capital at very high rates of return.”[11]  But the risk-adjusted return might be much higher at CABO.

[1] Form 10, page 2.

[2] Ibid. pages 2-3.

[3] December 8, 2014, Graham Holdings Co at UBS Global Media and Communications Conference

[4] Form 10, page 3

[5] The Outsiders, page 41.

[6] “What we’re not doing, which is another important part of the analysis, we are not chasing volume there either. Even though we are HSD-centric in our residential thinking, we’re still going for the more profitable part of the market rather than just trying to build up our volume of HSD. So if we can grow just 2% or 3% in units, but do it persistently for a long period time, we are thrilled. Rather than having 5% to 7% growth in one year, but a lot of that coming in at ARPUs down in the 30s or something of that sort.

On the broadband side, we would love to get a little bit from ARPU, a little bit from usage-based billing, and a little bit from rate increases. To not be too specific, but it’s a combination of all three of those, a little bit each year, that we think particularly with our low penetration — we have a lot of upside opportunity — gives us quite a few years of nice single-digit opportunity if we execute well and get a little bit from each of those three sources.”  CEO Tom Might, Q2 Earnings Call

[7] Tom Gayner, “Evolution of a Value Investor,” Talks at Google, June 22, 2015.

[8] Ibid.

[9] 2012 letter to Berkshire Hathaway shareholders.

[10] More from Buffett:  By making repurchases when a company’s market value is well below its business value, management clearly demonstrates that it is given to actions that enhance the wealth of shareholders, rather than to actions that expand management’s domain but that do nothing for (or even harm) shareholders.”
Letter to Berkshire Hathaway shareholders, 1984

[11] Warren Buffett, 1992 Berkshire Hathaway Shareholder Letter